What is KD (dissociation constant)
The dissociation constant, written KD, is the concentration of one binding partner at which half of the other is bound. It is the standard measure of binding affinity: the lower the KD, the tighter the two molecules bind. Conceptually it is the equilibrium constant for two partners coming apart; experimentally it is the analyte concentration at which half of the available binding sites are occupied. KD is reported in units of concentration, most often nanomolar (nM) or micromolar (µM).
What does the dissociation constant actually measure?
KD measures the strength of a molecular interaction at equilibrium. Two partners, such as a receptor and a ligand, or an antibody and an antigen, are constantly binding and coming apart in solution. KD captures the balance point between those two tendencies. A small KD, for example 1 nM, means that even a tiny amount of ligand is enough to occupy half of the available receptors, so the pair binds tightly. A large KD, for example 100 µM, means a much higher ligand concentration is needed before significant binding occurs, so the pair binds weakly.
A lower KD means higher affinity, and a higher KD means lower affinity.
What is the KD formula?
For two binding partners, a receptor R and a ligand L, forming a complex RL:
R + L ⇌ RL
the dissociation constant is the ratio of the free partners to the complex at equilibrium:
KD = [R][L] / [RL]
where [R] and [L] are the concentrations of the free (unbound) partners and [RL] is the concentration of the complex. Because it is a ratio of two concentrations to one, KD itself has units of concentration.
The same value also describes receptor occupancy. The fraction of receptor that is bound depends only on the free ligand concentration and KD:
fraction bound = [L] / (KD + [L])
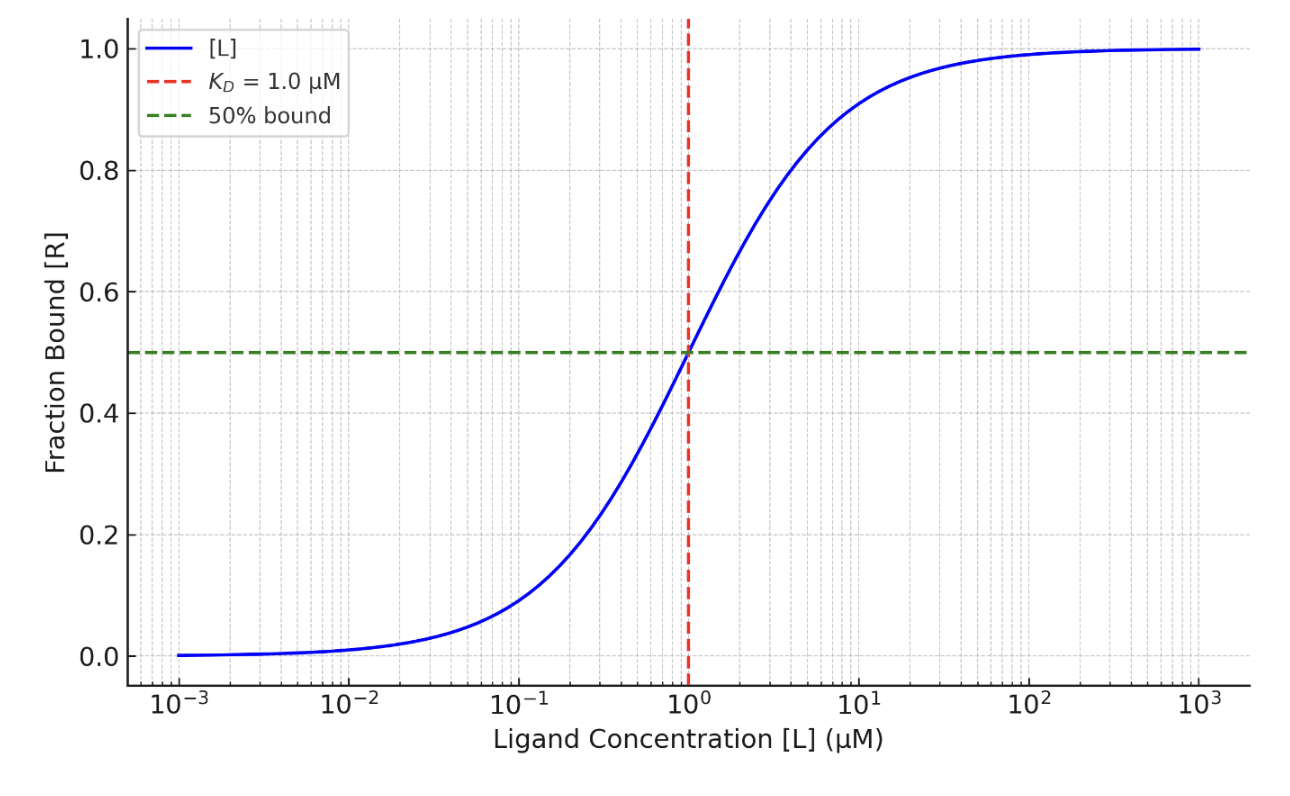
When the free ligand concentration equals KD, that fraction is exactly one half. This is why KD is described as the concentration at which half of the binding sites are occupied, and why it can be read straight off a binding curve.
How do you read KD off a binding curve?
Plot the percentage of receptor occupancy on the vertical axis against ligand concentration on the horizontal axis, and the curve rises from zero to a plateau at full occupancy. KD is the concentration that sits at 50% occupancy, halfway up the curve. Reaching a clear plateau matters: without it, the top of the curve is not defined and the fit for KD is unreliable. That is why a well designed affinity experiment titrates the analyte high enough to reach full complex formation.
What units is KD measured in?
KD is a concentration, so it is expressed in molar units: molar (M) and, in practice, millimolar (mM), micromolar (µM), nanomolar (nM) or picomolar (pM). The smaller the number, the tighter the binding. A picomolar KD describes an extremely strong interaction; a micromolar or millimolar KD describes a weak one.
What are typical KD values?
Typical values depend on the kind of interaction. Antibody and antigen pairs often bind in the nanomolar range or tighter, which is why antibodies are prized for their specificity. Enzyme and substrate interactions tend to show higher KD values than antibodies, reflecting the more transient binding needed for turnover. As a rough guide, a KD around 1 nM reflects strong binding, while a KD in the 10 to 1000 µM range reflects progressively weaker binding.
KD versus Ka: what is the difference?
KD is the dissociation constant and Ka is the association constant, and they are reciprocals of one another:
Ka = 1 / KD
They describe the same interaction from opposite directions. KD has units of concentration and gets smaller as binding gets tighter, so lower is stronger. Ka has units of inverse concentration (1/M) and gets larger as binding gets tighter, so higher is stronger. Affinity data is most often reported as KD because a concentration is easy to compare against the concentrations used in an experiment. Note that this association constant Ka is not the same quantity as the acid dissociation constant, sometimes also written Ka, used in acid-base chemistry.
What does KD mean in pharmacology?
In pharmacology, affinity is a measure of the strength of drug-receptor binding, and KD is the number that quantifies it. A drug with a lower KD binds its target more tightly and occupies more of the receptor at a given concentration. That is why KD is central to drug discovery: comparing KD values lets teams rank and optimise lead compounds by how strongly they engage their target. The same logic carries into enzymology, where KD values guide the study of enzyme-substrate interactions.
How is KD measured?
Because KD is defined at equilibrium, it is measured by watching how much complex forms as one partner is titrated against the other, then fitting a binding curve. Several biophysical methods do this, including surface plasmon resonance (SPR), bio-layer interferometry (BLI), isothermal titration calorimetry (ITC) and microscale thermophoresis (MST). They differ mainly in whether a partner has to be immobilised on a surface and in how much material and sample handling they need.
How does FIDA measure KD?
Flow Induced Dispersion Analysis (FIDA) is an efficient, in-solution method for protein characterisation, measuring molecular size (hydrodynamic radius), aggregation, and complex molecular interactions including binding affinity and kinetics. It measures KD from the change in molecular size when two partners bind. When biomolecules interact and form a complex in solution, the complex diffuses more slowly than the free partners, which broadens its dispersion profile. Using the Stokes-Einstein equation, the FIDA software converts that change into an increase in hydrodynamic radius (Rh): the more the size grows across a titration, the more complex has formed.
A FIDA binding assay works by titration. FIDA is a fluorescence-based technique, so one partner carries the signal: a protein with intrinsic fluorescence, or one labelled with a fluorophore. That partner is the indicator, and it is held at a constant concentration. The other partner, the analyte, is titrated in at increasing concentrations, high enough to reach a plateau on the binding curve and ensure full complex formation. From a single titration, FIDA returns the size of the indicator alone, the size of the indicator-analyte complex, and the binding affinity, KD, between them. Because the measurement is made directly in solution with nothing immobilised, it avoids the surface effects of immobilisation-based methods and works from very small sample volumes, including in complex matrices.

Frequently asked questions
What is affinity, and how does it relate to KD?
Affinity describes the strength of a molecular interaction. High affinity means the partners bind strongly, low affinity means they bind weakly, and KD is the number that puts a value on it. A lower KD means higher affinity. For example, a KD of 1 nM reflects strong binding, while a KD of 1 µM reflects weaker binding.
How do you interpret a KD result?
Compare the number. A lower KD means higher affinity, so the molecules form a stable complex even at low concentrations. A higher KD means lower affinity, so higher concentrations of ligand are needed before much complex forms.
How do you set up a binding affinity assay?
Keep the indicator (the fluorescent partner) at a fixed concentration and titrate the analyte in at increasing concentrations. Make sure the highest analyte concentration is enough to reach a plateau on the binding curve, so the complex is fully formed. That lets you extract the size of the indicator alone, the size of the complex, and the KD between them.
What is a good KD value?
It depends on the application. For antibody-antigen and many drug-target pairs, nanomolar or tighter is considered strong. There is no single good value: the right target depends on what the interaction has to do.
Related resources
To see KD measured in practice, the application note Smarter workflow, earlier insight, confident decisions: combining Biacore SPR and FIDA shows FIDA affinities validated side by side with SPR, and Reversible oligomerization and FIDA: from label-free detection to oligomerization KD determination walks through extracting a KD from a real titration. The poster Exploring drug interactions: a sneak peek with FIDA is a short visual overview of small-molecule affinity work. For the underlying method, the peer-reviewed paper Immobilization-free binding and affinity characterization of higher-order bispecific antibody complexes is the foundational account of measuring affinity by size in solution, and the recorded talk Can KD be determined in one minute? Speeding up your small-molecule work covers fast KD screening.
For the underlying readout and related concepts, see the binding affinity readout page for how FIDA reports affinity, the binding kinetics readout for association and dissociation rates, and the knowledge base articles on hydrodynamic radius and the Stokes-Einstein equation, the physics FIDA uses to turn a size change into a KD.